
Fast off-rate binding looks like no binding on an endpoint assay. SPR sees it. Martelly et al., Biomolecules 15:882 (June 2025)
Our second SPOC paper was published in Biomolecules (Martelly et al., 2025) as an Editor’s Choice article. The work compares two commercial anti-HaloTag antibodies on the same protein arrays using two readouts: a fluorescence endpoint assay on glass slides, and real-time SPR on a SPOC biosensor. The endpoint assay returned very different binding profiles for the two antibodies. SPR resolved why.
The setup
The same nanowell-printed plasmid library was used to express IVTT HaloTag-fusion proteins onto either a HaloTag chloro-alkane-coated glass slide for fluorescence, or a SPOC SPR biosensor for real-time analysis. Both substrates were probed with the same two reagents: Antibody #1 (Proteintech 28a8, mouse monoclonal) and Antibody #2 (Promega G9281, rabbit polyclonal). Both are routine tool reagents for confirming HaloTag protein capture.

Two anti-HaloTag antibodies were screened by fluorescence endpoint and real-time SPR. Antibody #2 (green) was detected by both assays. Antibody #1 (blue) was detected only by SPR. Antibody #1 has a faster off-rate than Antibody #2, limiting its detection in endpoint format.
Endpoint vs real-time
On the glass slide endpoint assay, Antibody #1 detected 6 out of 86 expected HaloTag spots per subarray (~7%). Antibody #2 detected 84 out of 86 (~98%). On those numbers alone, Antibody #1 looks like a poor reagent and the protein expression looks like it failed for most of the array.
On the SPR biosensor with the same library, both antibodies bound HaloTag protein. Antibody #1 produced Rmax of 150 to 250 RU across the array. Antibody #2 produced higher Rmax up to 350 RU. The two antibodies separated cleanly on kinetics. Antibody #1 reached steady state within roughly 10 minutes of injection and dissociated rapidly once buffer flow resumed. Antibody #2 did not reach steady state over 15 minutes of association and showed negligible dissociation.
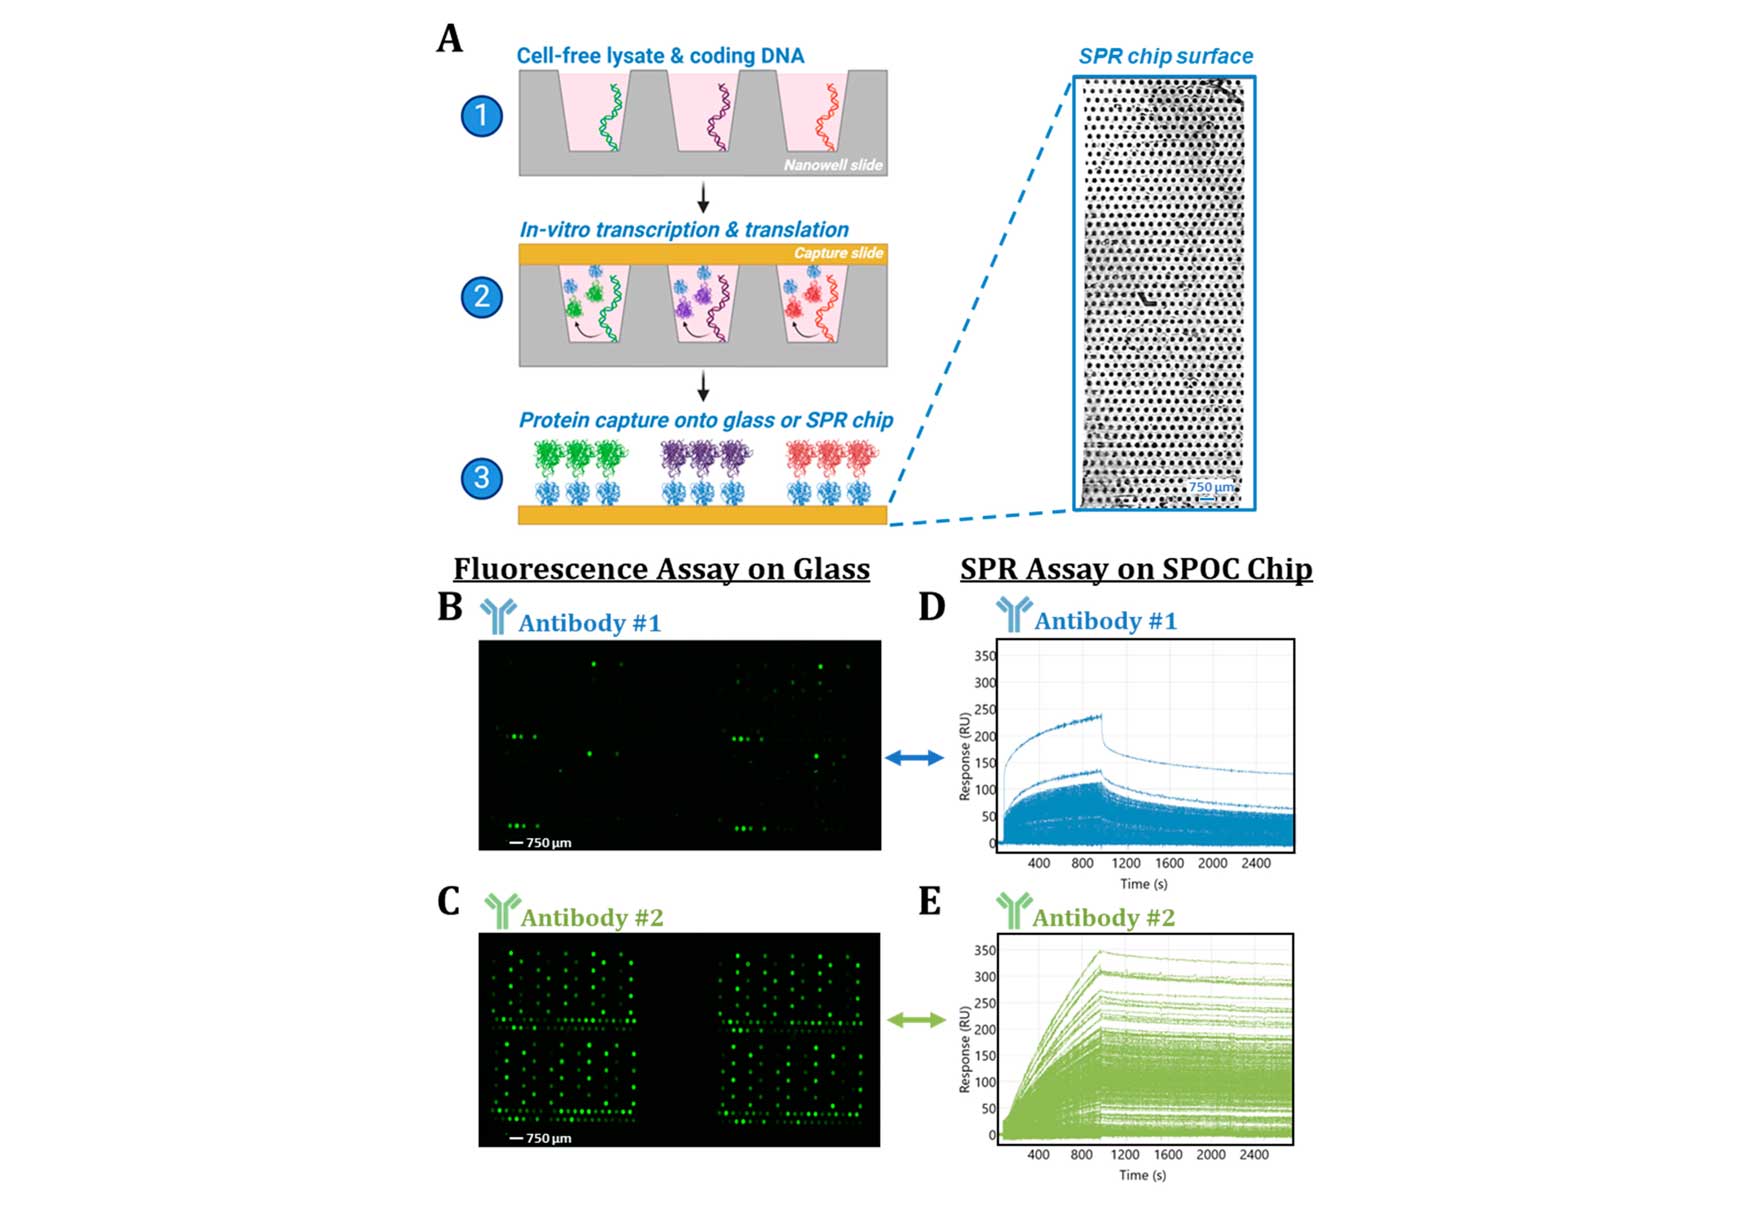
(A) SPOC biosensor production workflow via the Protein NanoFactory system, with an image of the biosensor surface in the LSAXT flow cell. The hockey stick-shaped fiducial mark orients the array. (B) Glass slide probed with Antibody #1, detected with Cy3 goat anti-mouse secondary. (C) Same slide reprobed with Antibody #2 and Cy3 goat anti-rabbit secondary. Two of four subarrays shown (see Figure A1 for full scans). (D, E) Sensorgrams from 355 spots on the SPOC biosensor during 133.3 nM injections of Antibody #1 (blue) and Antibody #2 (green): 15 min association, 30 min dissociation. Each trace is one ROI. Individual sensorgrams in Figure A2.
Fitting a 1:1 binding model to the dissociation phase gave an average kd of 6.13 × 10⁻⁴ for Antibody #1 and 5.77 × 10⁻⁵ for Antibody #2. The bound complex half-life worked out to ~18.8 minutes for Antibody #1 and ~200 minutes for Antibody #2, a 10-fold difference.
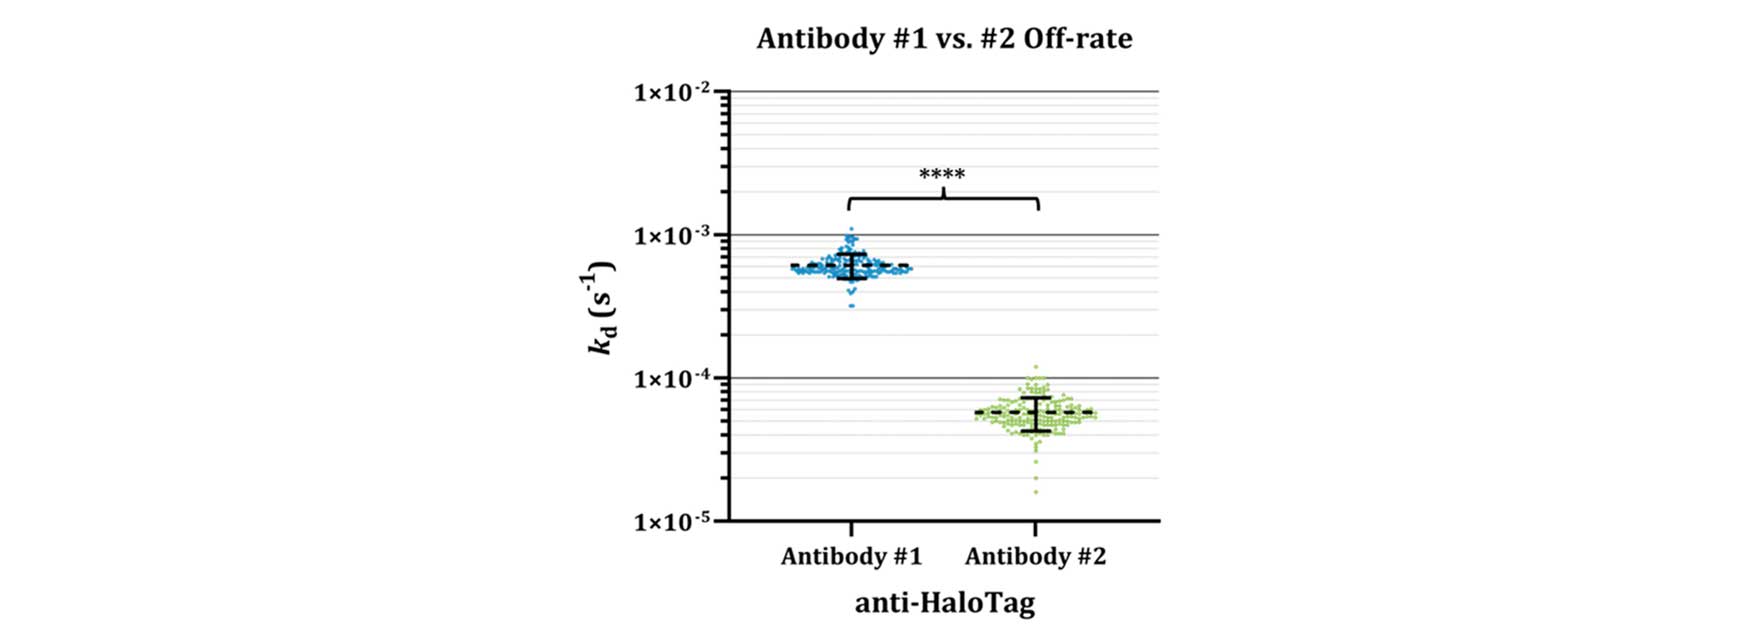
Off-rate (kd) values measured at individual HaloTag spots on the SPOC biosensor after a 30 min dissociation phase, for Antibody #1 (blue) and Antibody #2 (green). Mean (dashed line) and standard deviation (error bars) overlaid. n = 197, **** p < 0.0001.
The kinetic data explain the endpoint result. The endpoint protocol involves multiple wash and secondary incubation steps that give a fast-off-rate antibody time to dissociate before detection. SPR captures the interaction as it forms.
Acid regeneration revealed a second factor
When the SPOC biosensor was treated with 10 mM Glycine-HCl (pH 2.4), Antibody #1 binding signals jumped. After a 5-minute exposure to the same acid wash on the glass slide, the endpoint assay detected Antibody #1 on 82 out of 86 expected spots (~95%), up from ~7% pre-treatment. SPR Rmax for Antibody #1 increased to ~600 RU after acid regeneration, and its kd dropped from 6.13 × 10⁻⁴ to 2.99 × 10⁻⁴ (t1/2 ~38.6 min, roughly 2-fold more stable than pre-regeneration).

Glass slide probed with Antibody #1 and Cy3 goat anti-mouse secondary, before (A) and after (B) a 5 min wash with 10 mM Glycine-HCl (pH 2.4). Sensorgrams from 355 spots on the SPOC biosensor during Antibody #1 injection before (C) and after (D) acid regeneration, and during Antibody #2 injection before (E) and after (F) regeneration. Panels (C) and (E) are also shown in Figure 2D, E, reproduced here for comparison. Each trace is one ROI. (G) Proposed cryptic epitope model: acid exposure unmasks a HaloTag epitope recognized by Antibody #1.
Acid treatment had minimal effect on Antibody #2. Pre- and post-regeneration Rmax values correlated at R² = 0.909, and t1/2 dropped slightly from ~200 min to ~165 min.
The paper proposes that acid exposure induces a conformational change in the HaloTag protein that reveals a cryptic epitope recognized by Antibody #1.
Stability under repeated regeneration
The HaloTag-chloroalkane covalent capture chemistry holds up under harsh regeneration. Ten serial Antibody #1 injections returned to baseline cleanly after each Glycine-HCl cycle. Across a 24-hour experiment with 35 regeneration cycles, Antibody #1 binding response at the start and end of the run correlated at R² = 0.999.
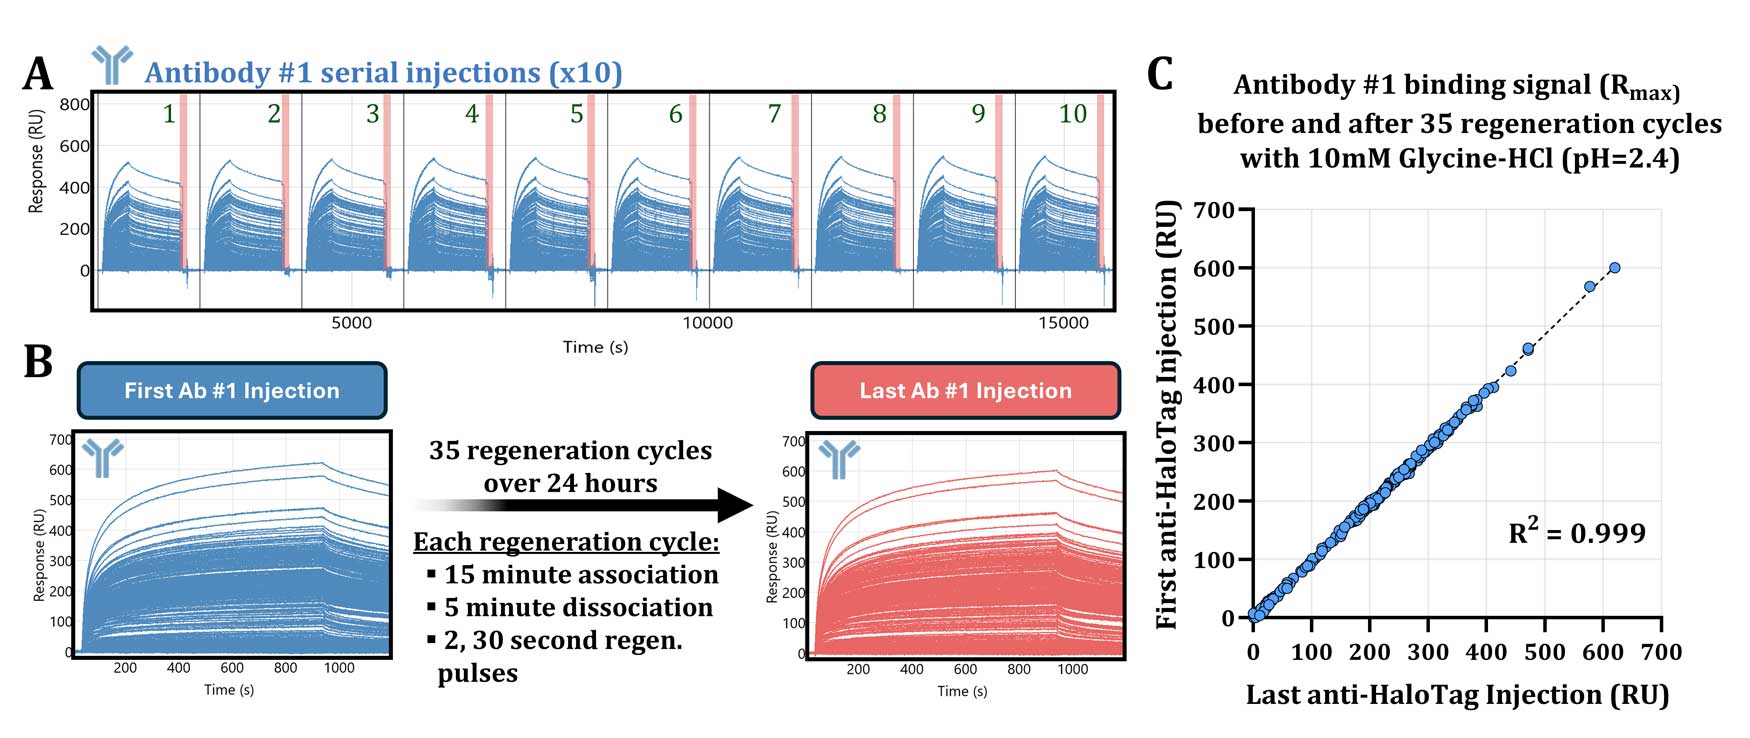
The biosensor was already acid-exposed in this experiment, so no Antibody #1 signal increase is expected. (A) Ten serial Antibody #1 injections (blue) with 60 s of 10 mM Glycine-HCl (pH 2.4) regeneration (red bars) between each. Return to baseline after each regeneration confirms complete removal of bound antibody. (B) Antibody #1 sensorgrams before (blue) and after (red) 35 acid regeneration cycles. (C) Scatter plot of Rmax values from the first (Y-axis) vs final (X-axis) Antibody #1 injection across the 35 cycles.
Implications for off-target screening
Secondary pharmacological profiling for off-target binding is a regulatory requirement for investigational new drugs and is run primarily on endpoint assays (radioligand or fluorescence). About 30% of drug failures are attributed to off-target binding. About 75% of adverse drug reactions are dose-limiting toxicities, often driven by interactions weaker than the intended on-target.
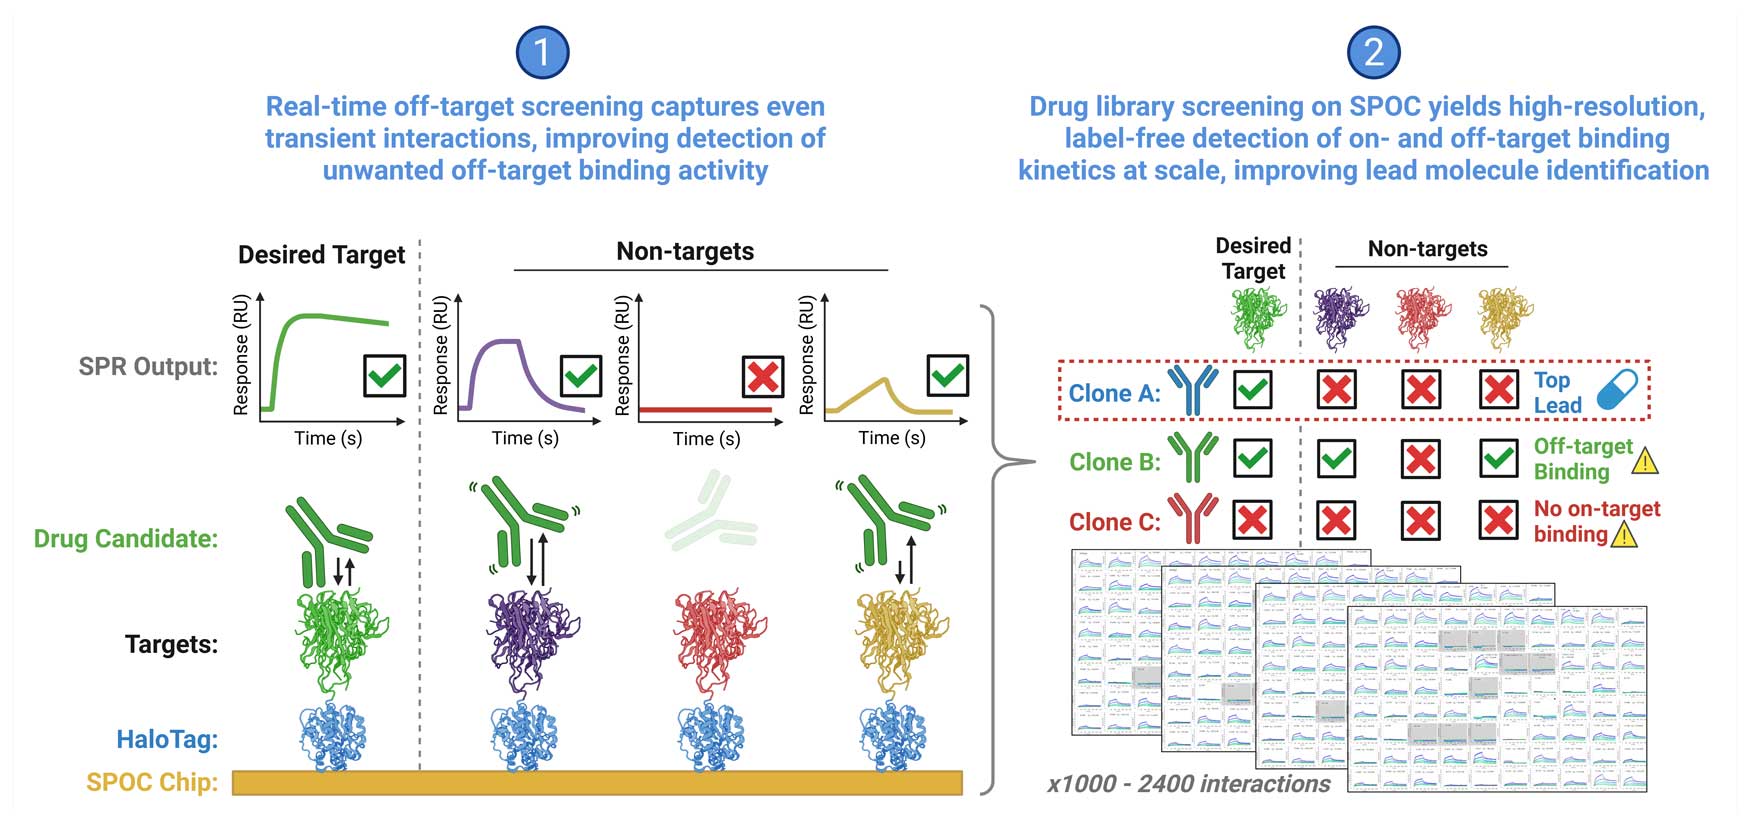
SPOC applied to off-target screening in early drug discovery. Catalog chips of 1,000 to 2,400 targets per chip, organized by target class, biochemistry, or application, are synthesized cell-free on demand. Therapeutic libraries or lead candidates are screened by real-time SPR. On-target binding is confirmed, transient off-target interactions are flagged, and candidates with adverse promiscuity are excluded.
Off-target interactions with fast off-rates become significant at elevated clinical doses. The SPOC paper data compare an endpoint readout (7% of spots detected) against a real-time readout (binding across the array) for the same antibody on the same library on the same day.
Read the paper (open access): https://www.mdpi.com/2218-273X/15/6/882
